


Establishing a hydraulic model is the start to leveraging smart technologies in the age of the Fourth Industrial Revolution (4IR), which is spawning concepts like digital infrastructure twins, the internet of things (IoT), artificial intelligence, cloud processing and real-time data transfer from electronic metering devices and sensors.
Over the past 30 years, GLS Consulting has established hydraulic models of real world, physical water distribution systems for 62 of the 144 municipal water services authorities in South Africa. The total length of water pipelines modelled is 91 059 km with a total water consumption of just over six billion litres per day (6 000 Mℓ/day). The population in these 62 municipalities amounts to 30.2 million people, which represents half of the South African population. Within smaller municipalities and large rural ones, it is often found that the information required to support the establishment of hydraulic models is wholly inadequate. However, through close collaboration – and with engineering adaptation and innovation – new and exciting (often disruptive) approaches to modelling have been developed by GLS for municipalities and water boards to solve these challenges. The complete modelling process entails building a digital or computer model of the infrastructure, and then developing a water consumption database. Applying the consumption database to the infrastructure model results in the creation of a hydraulic model. These steps are shown in Figure 1. The journey to establish a hydraulic model (about a year), embrace technology and become a smart water service provider is less daunting when viewed as an incremental process. Each step in the journey adds value to municipal engineers and managers by offering increased access to data, which leads to more knowledge and better decision-making. The foundation that this journey is built on is a well-established, geospatially accurate hydraulic model that reflects real-world assets and system operations, as feasibly as possible. ESTABLISHMENT OF A SMART DIGITAL INFRASTRUCTURE MODEL Data collection All existing sources of information pertaining to the water distribution system need to be collected and assimilated in the hydraulic modelling software. These sources can vary from as-built drawings – both physical paper drawings and computer-aided design (CAD) files – GIS databases, technical project completion reports and operational staff knowledge. Separate from municipal information, additional pipe catalogue and unit costing information can be collected and set up in a database file that is imported into the modelling software. Building the model of the infrastructure From the information collected, all infrastructure assets are imported and captured in the model software GIS environment, and network connectivity rules are enforced. Leveraging GIS capabilities (e.g., spatial correlation) allows for data transfer from various information sources to occur at a rapid rate. If up-to-date aerial imagery is not available, then the use of online maps from either publicly accessible or licensed sources can be used for the verification of asset location, especially reservoirs, or pipe routes. Infrastructure components that are not required for the operation of a basic hydraulic model (e.g. a hydrant, air valve or shut-off valve) should still be imported or captured if data is available to expand the asset register and may be required if more advanced analyses are considered in future. Pipe and other asset Information The already established and imported pipe catalogue can be used to fill in relevant fields in the model database table, such as material, internal and external pipe diameter and friction coefficients, through a system of dropdown selections. This reduces manual data entry requirements and ensures consistency. The pipe catalogue can be used while capturing individual pipes or to update information of a larger selection of pipes at once. Age information is captured by providing the construction or refurbishment year and, in combination with the material, provides knowledge on the expected useful life (EUL) and the remaining useful life (RUL) ofthe asset. With the use of the unit cost file imported into the model software, the construction or replacement value of the assets can be calculated based on physical attributes and location. The location of buried infrastructure plays a vital role in replacement or refurbishment costs when excavation and backfilling is considered. Intangibles like traffic control are also affected, especially when the asset is buried under a major roadway or residential street, and different costings will apply to assets located in a servitude or open space. Verification of model integrity Various software routines exist to verify the integrity of the established model. This includes a ‘traversal function’ (e.g. a routine to determine all pipes connected to one selected pipe) to confirm zone isolation and the connection of nodes to sources of water, such as reservoirs. During initial assessments, the location of reservoirs and their associated viable reservoir zones remain critical to assess initial static pressure requirements at consumers. It is here that the knowledge of operational staff can be invaluable. Finally, the computer or software hydraulic solver will report problematic issues to the user on network connectivity – e.g. zones that are without a source of water but have demand, or the connection of links and nodes in a way that is illegal for the solver, or the connection of pressure-reducing valves directly to reservoirs. Challenges in building the infrastructure model The quality of data remains the single biggest challenge. Often, as-built plans are simply missing, and parts of the network will have to be estimated. The concept of dummy pipes or provisional pipes in the model can be useful but must be clearly identified for follow-up and on-site inspection at a later stage when budget allows. Pipe roughness values – important for the hydraulic model to accurately calculate flow and velocities in links and pressure head at nodes – remains a challenge when the internal size of pipes and even their existence is uncertain. An iterative approach is recommended, where the data integrity is clearly marked as ‘estimated’ or ‘provisional’ and later refinement is planned. Figures 2A and 2B show the results of data collection and model building to provide a digital representation of Drakenstein Municipality’s water infrastructure model, at two different zoom levels, with different line colours representing different pipe diameters.

If bulk water meter readings are available, then the system-wide non-revenue water (NRW) can be calculated. Various resources are available from the International Water Association (IWA) to assist with the calculation of NRW, such as the Infrastructure Leaking Index (ILA).
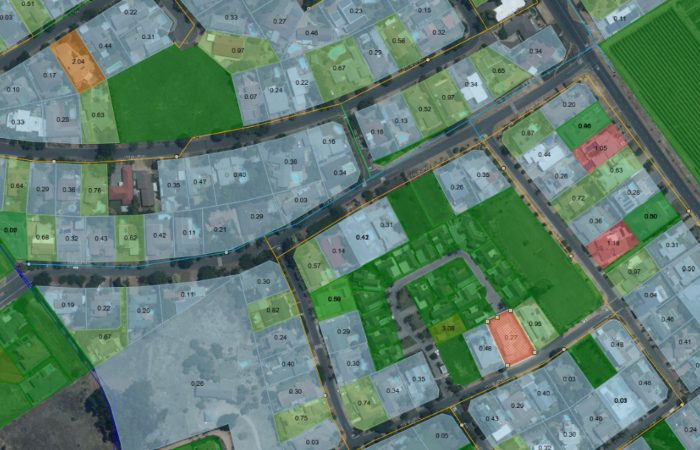
Summary reports per suburb can be generated from the software indicating the water demand per land use per suburb. Or a global average can be determined in cases where no meters exist – e.g. in rural villages. Figure 4 shows a map of the AADD per stand from a subset of the Drakenstein Municipality’s billing database. The one selected stand shows an AADD of 0.27 Kℓ/day, which is efficient for a 1 000 m2 stand. To create a digital representation of the real-world system, the water consumption database must be loaded on to the model representing the infrastructure. This is achieved by extracting demands per stand and combining them with the spatial data from the cadastral layout. This spatial linking results in a more accurate model. With the infrastructure model populated with water demands, water consumption per reservoir distribution zone can be established. These digital zone demands can be compared to physical zones where water usage can be tracked using bulk water meters. THE HYDRAULIC MODEL AND DIGITAL TWIN Once the water demands have been loaded on to the infrastructure model, the hydraulic software mathematically simulates the flows and pressures in the entire system. Once again, these digital results can be compared to physical results in the field, should level, flow and pressure sensors or loggers be available at strategic locations. The digital simulation will make apparent all pipes that have high flows and low pressures that fall outside the parameters of design guidelines. The hydraulic modeller then redesigns the network by digitally reinforcing pipes to understand adjustments required in the physical system to improve flows and pressures.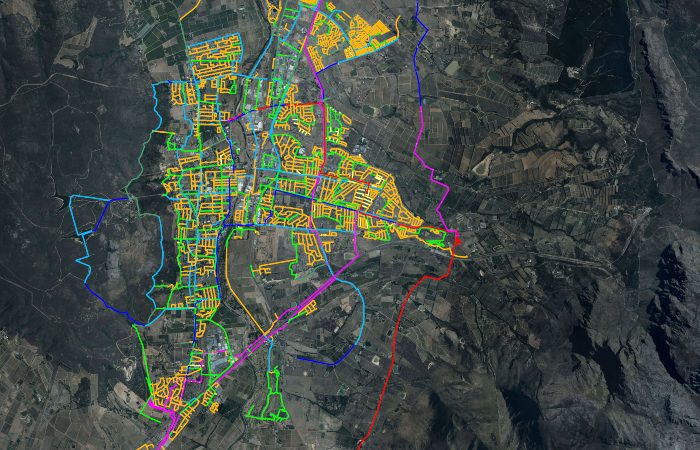
be added to the model and the future demands allocated. The master plan or future model consists of the existing system model, which is merged with the pipes required for the future development areas, and then reinforced where required so that the design criteria are met. Additional reservoirs can also form part of the future model. Individual pipe and system upgrades can be identified, and an associated cost calculated for each item. The expected or proposed implementation year can also be assigned to the item. Projects are created, which may contain several items, and can span over several years e.g. – a new reservoir and main outflow pipe to a new township or a rezoning project after a new reservoir has been completed. Multi-year capital programme summaries can be produced from the master plan projects and their selected implementation year. Inversely, in cases where access to funding is constrained, the available funds for each financial year can be used to impose phasing on the most critical projects. Asset register Detailed model summary reports by suburb, pipe sizes, total length, age, pipe material, RUL, replacement values and more can be generated, forming a solid basis for an asset register. Plan books and valve closure programmes for operational staff Plan books can be generated that show the detail of the existing system, including the location of valves and hydrants for operational and field staff. The digital water model network that mirrors the physical system and known valve locations allows for the determination of valve closure programmes in the event of pipe bursts or other maintenance activities to isolate sections of the system. Furthermore, if the model has been linked to a consumer database, the affected stands may be reported and, by embracing innovative technology, an automated notification system can send mobile notifications to the affected users when unplanned maintenance activities occur. Sensitivity analysis What-if scenarios can be run using methods such as sensitivity analyses. This allows various combinations of growth or water restriction demand patterns to be investigated to ensure the system will be able to cater for changes. This might include consequences of potential rezoning or the densification of an existing zone. Pipe replacement programmes A pipe replacement prioritisation (PRP) study can be performed to identify the pipes with the highest comparative risk of failure or greatest criticality grade should failure occur. This clears the way to proactively budget for annual pipe replacement programmes, replacing pipes that cause maintenance headaches due to age and other factors. Fire risk compliance study Fire risk compliance analyses can be performed to ensure that the entire system is compliant with regulations by being able to provide the 20 ℓ/s, 50 ℓ/s or 100 ℓ/s at specified locations for firefighting purposes, or to which extent there is a shortfall. A level of compliance in terms of firefighting ‘readiness’ can be attributed to every stand, and the network capability to deliver the required flow tested. Display of models on online platforms All model data can be exported and spatially viewed on online platforms that allow quick and easy access to view-only system information for managers, designers and operational staff whenever and wherever needed. Of particular interest is also viewing the integrity of information collected (e.g. estimated pipe sizes) to plan data collection improvements projects. Conclusion Overcoming the first hurdles to becoming a smart water municipality or utility starts with establishing a hydraulic model from infrastructure information and billing data. Once a water utility has made a start with a hydraulic model, the downstream benefits – such as being able to develop a master plan and establish accurate multi-year capital and PRP programme budgets, plus many more – are fairly easily achieved.


