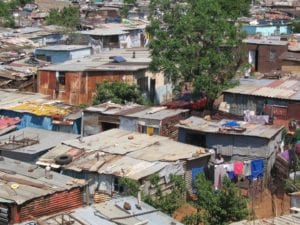
The percentage of households living in informal dwellings has only decreased from 13.6% to 13.1%
This is according to Stat’s SA’s recently released
GHS Series Volume VII: Housing from a human settlement perspective report.
According to Stats SA, this increase in formal dwellings signifies that the formalisation of housing arrangements in the country surpassed household growth.
But how far have we really come?
Although there has been a decrease in the urban population of South Africa living in informal settlements from 17% in 2002 to 11% in 2014, the during the same time period.
The difference can be attributed to increases in households living in informal dwellings in the backyards of other dwelling types.
In 2014 North West (21%) and Gauteng (19%) had the highest proportion of households still living in informal settlements, while the former also had the biggest percentage increase of its urban population living in informal settlements in general (45,1%).
The biggest declines in the percentage of the urban population living in informal settlements during the reference period were found in Limpopo (-75.5%), Mpumalanga (-63%) and Free State (-44%).
From a municipal perspective, Gauteng (81.8%) and Free State (80%) had the biggest proportion of municipalities where more than 5% of the dwellings consist of backyard informal dwellings. In Western Cape, 44% of municipalities were affected and 38.9% of local municipalities in North West were affected. These same provinces also carry the heaviest load in terms of the actual levels of informal dwellings in the backyard.
Free State had four municipalities amongst the top ten with increases, followed by Western Cape with two.
Most of the municipalities that experienced a contraction in the percentage of backyard dwellings were areas that were affected by a reduction in either mining or manufacturing activities during the reference period. Thus, the decreases may have as much to do with better provisioning by the local municipality than it does with a reduction in economic opportunities and, per implication, demand for housing by migrant workers.
RDP housing
The progress on access to formal housing in the case of RDP and state subsidised housing can be traced in the Free State whereas Limpopo had relatively little growth in access to RDP or state-subsidised housing. However, the report indicates that the percentage of households in Limpopo living in formal houses increased from 82% to 94% between 2002 and 2014.
According to Stats SA, the rate of housing provisioning of RDP or state-subsidised dwellings has surpassed that of the private sector between 2009 and 2014.
Home ownership
The report indicates that there was a general decline in home ownership rates between 2001 and 2011. However, ownership rates increased in Free State and Eastern Cape. The biggest decline was found in Gauteng at 7.6 percentage points. The age group 20 to 34 years was most affected.
Factors such as the introduction of the Credit Control Act, the world economic crises as well as the greater availability of rental stock for low-income households in large urban centres may have contributed to this.
According to the GHS report, rental of formal dwellings increased from 20% to 22% between 2002 and 2014, whilst rental of informal dwellings nearly doubled from 19% to 36% during the same reference period.
Housing values
Putting the value of the dwellings occupied by South African households under consideration, stark differences between population groups begin to emerge.
More than half of South African households headed by the black Africans lived in dwellings that were valued at less than R50 000, whereas most households headed by Indians, Asians and whites lived in properties valued at R400 000 or more.
In terms of the number of rooms in dwellings and per implication size there has been a shift between 2002 and 2014 towards more rooms in formal dwellings and changes from multiple rooms in informal housing to 1 to 2 rooms.
Some relationship has been found between household income status and the kind of dwelling occupied especially in relation to traditional dwellings. The latter were most likely to be occupied by quintile 1 and 2 households, while quintile 5 (the wealthiest quintile) households were most likely to live in formal dwellings. Informal dwellings were generally occupied by an even spread of households between quintiles 1 and 4.