 The number of consumer units receiving services from municipalities increased between 2014 and 2015.
Basic services
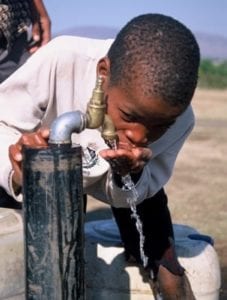
The provision of basic water increased by 2.5% nationally between 2014 and 2015. Water: The highest provincial increases for the provision of water were recorded in Western Cape (5%) and Mpumalanga (3.1%) while the lowest increase was recorded in Gauteng (1.3%). Electricity: The highest provincial increases were recorded in Mpumalanga (10.7%) and Gauteng (5.3%) while Limpopo recorded the lowest increase (1.6%). Sewerage and sanitation: The highest provincial increases were recorded in Mpumalanga (13.9%), Eastern Cape (5.7%), whereas the lowest increase was shown in KwaZulu-Natal and Gauteng (2.1% respectively). Solid waste management: the highest provincial increase was recorded in Mpumalanga (15.4%), Limpopo recorded the second highest increase at (9%) while Eastern Cape recorded the lowest increase at 1.3%.
Indigent households
In 2000, Cabinet announced government`s plan to roll out a free basic services programme to poor (or indigent) households. There were 3.6 million indigent households in 2015, as identified by municipalities. Out of this, 2.4 million (67.8%) benefited from the indigent support system for water, while 2.2 million (62.8%) benefited from free basic electricity provided by municipalities. The report also revealed that 2.1 million (58.7%) indigent households received free sewerage and sanitation while 2.1 million (57.6%) benefited from solid waste management. The report further recorded fluctuations in the free basic services provided to indigent households:- 83 796 fewer consumers received water in 2015 compared to 2014
- 124 147 more consumers received basic electricity in 2015 compared to 2014
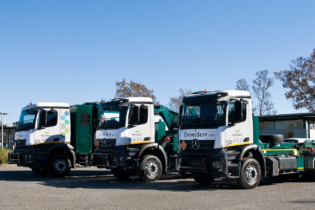
- 53 329 more consumers received basic solid waste management services in 2014 compared to 2015
- 23 444 fewer consumers received basic sewerage and sanitation in 2015 than in 2014


