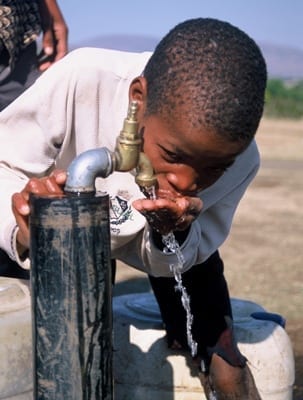
 Despite the South African government’s efforts to improve basic services nationwide, several areas across the country’s nine provinces still find it challenging to gain access to clean, running water.
Statistics South Africa (StatsSA) recently released its 2005-2015 general household survey which highlighted the improvements in access to water. It also indicated the number of households that still relied on ground water as a source of drinking water. These included:
- OR Tambo (49%)
- Alfred Nzo (46%)
- Zululand (24%)
- Sisonke (23%)
- UMkhanyakude (20%)
Improved access to drinking water
According to the report, nationally, 92,5% of households had access to improved drinking water sources.
The percentages were indicated as follows:
- Western Cape (99,4%)
- Free State (99,3%)
- Northern Cape (99,1%)
- Gauteng (98,6%)
The report also mentioned that Gauteng reported almost universal access to improved drinking water sources. The Eastern Cape had the lowest percentages of households (75,7%) with access to improved drinking water sources, however the province reported the largest percentage point increase from 2002, when 60,9% of households gained access to improved drinking water sources.
Improved access to municipal water
Nationally‚ the percentage of households with access to municipal water increased from 84% to 86%‚ however the number of households that reported interruptions during the 12 months before the survey increased from 23‚1% to 25‚4% between 2009 and 2015.
Improved access to sanitation facilities
The percentage of households with access to improved sanitation facilities increased from 62‚3% in 2002 to 80% in 2015. Many households in Western Cape (93‚3%) and Gauteng (91%) had access to improved sanitation facilities‚ against approximately half those in Limpopo (54%) and just below two thirds of those in Mpumalanga (65‚8%).
The metros with the highest percentage of households with access to improved sanitation facilities were the City of Johannesburg (96‚9%)‚ Nelson Mandela Bay (94‚6%) and the City of Cape Town (91‚8%). The metros with the lowest percentages of households with access to improved sanitation facilities were the City of Tshwane (82%) and eThekwini (83‚5%).
Urban versus rural
Urban households (30%) were more likely to share toilet facilities than rural households (16%). More than two-thirds (68%) of households living in informal dwellings shared toilet facilities as compared to nearly a fifth (19%) of households living in formal dwellings and 12% of households living in traditional dwellings.
Bucket toilet system and open defecation
Nationally, 1,2% of households reported using the bucket toilet system. Western Cape (4%) recorded the highest percentage of households using the bucket toilet system followed by Free State (2,7%) and Northern Cape (2,4%).
As many as 6,8% of households living in informal dwellings reported using the bucket toilet system.
Nationally, 4% of households practised open defecation, and these percentages were even higher for households living in traditional dwellings (12,1%) and informal dwellings (10,3%). The highest percentages of households that practised open defecation were reported in Buffalo City.
“A statistically significant correlation was found between open defecation and diarrhoeal diseases as underlying causes of deaths at District Council level‚” StatsSA said.
It added that adequate sanitation would reduce the risk of a broad range of diseases that included respiratory ailments‚ malaria‚ and diarrhoea. It would also reduce the prevalence of malnutrition. “Access to this standard of sanitation produces direct health gains by preventing disease and delivering economic and social benefits,” StatsSA said.
 Despite the South African government’s efforts to improve basic services nationwide, several areas across the country’s nine provinces still find it challenging to gain access to clean, running water.


