Correct raw water quality information is imperative for the optimum functioning of reverse osmosis (RO) plants and has a direct bearing on its design and projected operating costs. In the case of one of Cape Town’s key installations, unexpected environmental factors have come into play.
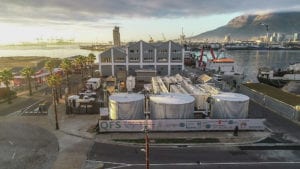
By Nico-Ben Janse van Rensburg* As is routine for a project of this nature, research studies were completed in preparation for the construction of Cape Town’s desalination plant at the V&A Waterfront. The data supplied to Quality Filtration Systems (QFS) formed the basis for the design and commissioning of the RO system. Feeding the plant is an abstraction point constructed in the harbour, about 16 m offshore. Based on the initial data provided, it was anticipated that the water salinity would remain reasonably constant. Preliminary data showed the water to be fairly clean following turbidity measurement. Factors that were taken into account included the presence of oil due to shipping activity, plus seasonal algal blooms that occur naturally. To mitigate the risk of oil ingress, the abstraction intake point was constructed at a depth of about 13 m. With its lower density, most of the oil present would float near the surface, while minimal dissolved oil would reach the bottom near the intake. In turn, the overdesigned capacity of the plant would provide sufficient buffer capacity to allow for shutdown during an algal bloom.Initial testing
During initial testing between 8 January 2018 and 5 March 2018, it was confirmed that the oil did not pose a significant risk, especially as the RO membranes only need to last for 24 months; however, an unexpected phenomenon occurred. The salinity, measured as total dissolved solids (TDS), showed great variance. TDS, as sampled at the extraction point and tested by AL Abbot, showed a variance between 38 710 mg/ℓ and 45 779 mg/ℓ. Past data provided in the tender document showed little variation, between 35 964 mg/ℓ and 37 744 mg/ℓ. As a consequence, there has been a significant increase in the amount of energy required to desalinate this water.Feedwater quality
During operation of the plant, it was also discovered that frequent spikes in water turbidity were occurring. The plant was initially designed to operate on sand filters followed by cartridge filters. The cartridge filters would require monthly replacement, while the sand filters would require a weekly backwash. The replacement frequency of the filters was based on a 95 percentile turbidity value of 3.9 NTU, with a single outlier of 7.4 NTU.During operation from March 2018 to May 2018, it was discovered that the sand filters did not require any backwash, while the cartridge filters needed far more regular replacement. The presence of raw sewage was determined to be one of the major causes. Frequent sampling of the sea water showed E. coli counts exceeding 150 counts per 100 mℓ.
Graph 1 shows the measured turbidity experienced from 28 March to 23 July 2018. The 95 percentile during this period was 20.6 NTU, while the mean was 10.3 NTU – that was a fourfold increase in the initial turbidity forecast. After May, and through the winter season of 2018, the turbidity became even worse. Graph 2 shows the measured turbidity during the winter period. At first glance, and with the same statistics calculated, it would seem that the situation had improved. The 95 percentile was slightly lower, at 17.4 NTU with a mean of 8.2 NTU. There were, however, frequent spikes. Experience showed that at levels above 15 NTU, a set of filters would become blocked within eight hours, requiring replacement. Experience also showed that the effects of a turbidity spike last beyond the point at which intake turbidity drops. These frequent spikes result in an average filter replacement cycle of every eight hours, rather than every month as per the initial design.

