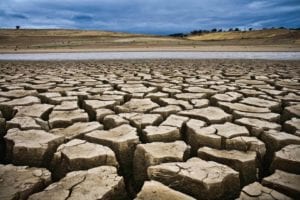
 Eight provinces have been declared to be in states of disaster due to the ongoing drought. Because of this, the Department of Water and Sanitation has imposed mandatory water reduction quotas of 15% in all provinces.
How these water reduction quotas will be achieved is the burning question. In looking at the average daily household consumption of potable water across South Africa, the typical household uses about 250 ℓper day, which amounts to 7 000 ℓa month – already more than the 6 000 ℓmonthly free water allowance every household receives from their municipality. At last count, there were 14.5 million households, which equates to 108 750 Mℓ per month or 1 305 000 Mℓ per annum – and this only represents 11.5% of South Africa’s total water consumption.
| Table: South Africa’s water use by category |
| Agricultural use (including irrigation) |
60% |
| Environmental use |
18% |
| Urban & domestic use |
11.5% |
| Mining & industrial use |
10.5% |
| Source: Waterwise |
So, what’s being done to reduce water consumption? As can be seen, households can only do so much, as can mining and industrial. This combined consumption represents 60% of the total potable water supplied. The other 40% is lost to water leaks in pipes and ageing infrastructure. Putting it into monetary terms, South Africa is losing R7 billion per annum due to leaks. And, because we need to sustain the environment, we can’t cut consumption here. Dying or dead wildlife doesn’t look good on tourist brochures, or in real life. Agriculture is going to have to get smarter. Drip irrigation is a technology used in the Arava Desert in Israel, with great success, and there are no poor farmers in this totally dry, rocky, sandy desert either. They use groundwater to great effect. Yields are excellent too.
War on Leaks
To achieve quotas, municipalities, with the help of the Department of Water and Sanitation (DWS), have launched a national War on Leaks programme. This involves visiting every township household to check plumbing for leaks, and repair what needs repairing. Under the auspices of the Energy and Water Sector Training Authority (EWSETA), a total of 15 000 plumbing technicians have been trained for this purpose, and with positive results. They are doing good work.
Ageing infrastructure
At all levels – national, provincial and municipal – we are dealing with backlogs and infrastructure more than 100 years old (Vereeniging was established in 1892). To eradicate this backlog in 20 or so years is impossible. And, with an increasing population, the changing urban landscape, the mushrooming of informal settlements and the increase in urban migration, these additive demands for water infrastructure and service delivery make it difficult to keep up.
In June 2015, Deputy Minister of Water and Sanitation Pamela Tshwete reported to parliament that the current total estimated replacement cost of South Africa’s water infrastructure was R1.2 trillion. The estimated investment requirement over ten years was R805 billion, or R81 billion per annum. The total funding available was R46 billion per annum, meaning there was a funding deficit of R35 billion per annum. The financing requirement had increased between 2011/12 and 2014/15, from R67 billion a year to R81 billion a year.
“A major problem was a lack of capacity in municipalities, combined with ageing infrastructure and vandalism. The bulk of the money in the plan would have to go to maintenance,” Tshwete said. This lack of capacity is a major stumbling block in our efforts to save water, which we must do to meet the DWS’s quotas. One major Free State city has run out of water. More will suffer this fate if we don’t stop ageing water infrastructure from leaking.
Where to begin
Despite these challenges, doing nothing is not an option. It’s a case of prioritisation. A well-known internal pipe inspection company has found a high incidence of substantial leaks in large diameter pipelines in South Africa. If we are not proactive, these leaks typically go undetected for longer periods of time – up to 20 years.
| Table: Cubic meters of water lost according to diameter of leak hole (mm) |
| Period |
2.5 mm |
6 mm |
8 mm |
13 mm |
19 mm |
25 mm |
| 1 Year |
4 600 |
29 000 |
51 400 |
116 000 |
262 000 |
464 000 |
| 5 Years |
23 200 |
145 000 |
258 000 |
580 000 |
1 306 000 |
2 322 000 |
| 10 Years |
46 400 |
290 000 |
514 000 |
1 160 000 |
2 612 000 |
4 642 000 |
| 20 Years |
580 000 |
580 000 |
1 030 000 |
2 322 000 |
5 222 000 |
9 284 000 |
Note: Measures are m3 of water lost per period e.g.20 years, and not per annum
Most established suburbs in towns and cities are metered. But many townships are not metered, and this is a problem.
The most effective solution is to meter your flows. This is N&Z Instrumentation’s speciality, and it has 60 years of experience. It’s a simple case of measuring all the water flows into a district, zone or sub-zone, and all the outflows. This water balance immediately reveals the extent of losses and provides solid information as to which areas to focus your leak detection on for maximum benefit. This is part of the No Drop process, which also provides the basic tools for assessment and monitoring.
There are three types of flow meter technologies, each with their own advantages and applications:
- Full bore meter: There are the old-type mechanical models, which tend to be less reliable, but now there is an inline battery-powered magnetic flow meter that is ideal for water distribution applications – because these meters are accurate and reliable, and don’t under-read as mechanical flow meters do. These are the most functional meters to install.
- Insertion meter: Complete with optional line pressure sensor, this insertion battery-powered flow meter is slightly less accurate than the full bore model but costs less, especially for large pipe lines. With the “hot tap” system, it can be installed while pipes are in use.
- Strap-on ultrasonic flow meters: Here, the Time of Flight principle is ideal for clear liquids and Fuji’s anti-bubble measurement algorithm enables measurement even with entrained gas bubbles of up to 12% by volume. Normal accuracies are ±0.5% to 1% of reading. However, accuracies of up to ±0.23% can be achieved where the pipe is sound and dimensions are accurately known. Portable flow meters are widely used for spot measurements or for checking the accuracy of existing flow meters. Fixed flow meters are easy to install as they do not require any downtime or changes to existing piping.
Integral with the flow meter, a data logger records flow rates, flow totals and pressure and transmits the data to a Scada Water Management Software System (WaMSS) that automatically graphs and reports for water loss, water management and AMR (automatic meter reading). The WaMSS Scada is a simple-to-use tool for logging, planning and implementation. It enables continual performance monitoring and trending and automatically compiles reports of key performance parameters. Its dashboard’s reports show the current week’s flow trend for multiple meters in a single report. It is ideal for management oversight and enables you to quickly identify situations requiring management attention.
WaMSS ‘Smart’ Loggers
South-African-designed and -manufactured battery-powered multi-purpose loggers with GPRS seamlessly integrate various flow meters and sensors into the WaMSS Scada. The WaMSS loggers accept pulse from flow meters and 4-20 mA inputs from sensors, and log the data at user-specified intervals. The data files are sent automatically by GPRS to the web-based WaMSS Scada. So you can easily incorporate existing flow meters into the AMR system or log parameters such as level, pressure. pH, conductivity, etc. into a simple-to-use, plug-and-play Scada. The loggers are easy to set up with N&Z’s intuitive software interface. There are two types of data loggers:
- WaMSlog ‘Smart’ Multi-Purpose Logger
- WaMSbeat ‘Smart’ Flow Logger
WaMSS Scada
This Scada system is web-based and is extremely user-friendly because it automatically compiles the reports you select and emails them to you. Besides the flow trends and flow totals, the WaMSS also provides line pressure, reservoir level management, the water balance as per the International Water Association model and Cathodic Potential.
 Eight provinces have been declared to be in states of disaster due to the ongoing drought. Because of this, the Department of Water and Sanitation has imposed mandatory water reduction quotas of 15% in all provinces.

