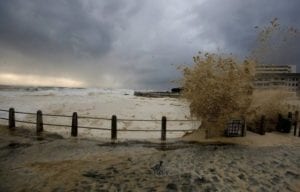
Recent storms which hit the City of Cape Town has contributed very little to the city’s water storage. Photo: Reuters / Mike Hutchings
What’s the cause of Cape water crisis?
According to Kevin Winter, a lecturer in Environmental and Geographical Sciences at the University of Cape Town, population growth, high water consumption and climate change were some of the key contributors to the Western Cape’s failing water levels. In May, the City of Cape Town reported that since 1995 the city’s population grew 55%, from about 2.4 million to an expected 4.3 million in 2018. However, over the same period, dam storage only increased 15%.Winter told GroundUp that the city’s catchment areas were receiving water later, dropping more erratically, and often missing the catchments altogether.
“We have to acknowledge that carbon dioxide is finding its way into the atmosphere and has reached a new high,” he said. “This is a global system, so the bigger systems are beginning to impact us … there is no doubt that pressure and temperature are related. So disturb the temperature, you disturb the pressure and you start to see different systems operating,” he explained. He also said that weather variability was suggesting two things. “One is that the drought interval is closing and that’s massively problematic if you can’t get a couple of good years to bring yourself back up,” he said. The other was that rainfall is coming later. He said this meant that we shouldn’t see the current water crisis as a temporary phenomenon that will resolve in a year or two, but said it was a long-term problem.National water storage
Across South Africa, dam levels saw a slight decline over the past week. The Department of Water and Sanitation said the national water storage has declined week on week. As Monday last week, average dam levels were 72.1%. The department said there has been a slight decrease in capacity in all provinces with the exception of the Northern Cape which saw a slight increase. Recent provincial dam levels are as follows:- Eastern Cape: down 0, 9% to 60, 3%
- Free Sate: down 0, 2% to 84, 2%
- Gauteng: down 0, 3% to 91, 5%
- KwaZulu-Natal: 0, 2% to 58, 2%
- Limpopo: down 0, 2% to 77, 8%
- Mpumalanga: down 0, 3% to 78, 9%
- Northern Cape: up 2, 4% to 89%
- North West: down 0, 5% to 88, 2%
- Western Cape: 20.4%


