The Western Cape Province, which is in the South West corner of South Africa, falls predominantly within two water management areas (WMAs), the Breede-Gouritz and the Berg-Olifants.
By GreenCape While South Africa is one of the most water stressed countries in the world with a medium to high baseline water stress (20% – 40% average annual withdrawal of available water supply), the majority of the Western Cape falls within the two highest water stress categories (40% – 80% and >80%). Water supply system The Western Cape Water Supply System (WCWSS) is a complex, interlinked system of dams, pipelines, and distribution networks that supplies water to the City of Cape Town (CCT), West Coast District Municipality (which supplies water to Swartland, Saldanha Bay, and Bergrivier local municipalities), Stellenbosch, Drakenstein, and Witzenberg local municipalities, and certain agricultural users. Total water allocation for the system is 590 million m3 per year, which is allocated to various end users. Approximately two-thirds of the allocation is for urban use (including residential, commercial, and industrial use), and the remainder is allocated for agriculture, which is predominantly used in the summer months. Irrigation to support agriculture constitutes the main water use in these two WMAs, followed by urban water use. <Insert Green Cape Figure 1 on page 31 of 104 of PDF> Overview of Western Cape Water Supply System allocations by type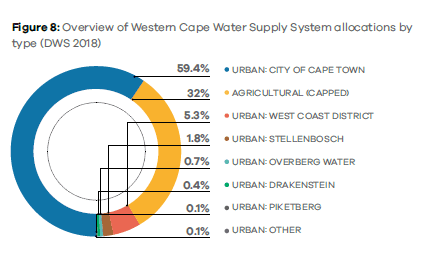

The ongoing effective demand side management, and resultant lower water use, was a key enabler in the recovery of dam levels. At the end of October 2020, the CCT’s average water consumption was 30% less than its allocation of 358 million m3 per year (981 MℓD) from the WCWSS. This highlights the importance and effectiveness of water conservation and water demand management (WCWDM), and water efficiency interventions, and the key role it has in managing the use of water resources.
However, non-revenue water (NRW) for Nonrevenue for some municipalities in the WC remains high at above the global best practice level (15%). <insert GreenCape Figure 2 on page 32 of 104 of PDF> Non-revenue water levels for Western Cape municipalities for 2020 (Source: DWS Dashboard, 2020)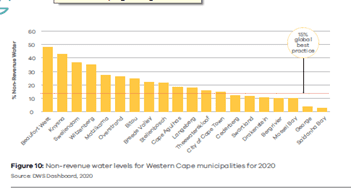
| Municipality | Non-Revenue % | Water Tariff (R/Kℓ) | Potential loss in revenue (R/kℓ) |
| Beaufort West | 48 | R19.89 | R9.55 |
| Bergriver | 10 | R8.78 | R0.88 |
| Bitou | 25 | R12.87 | R3.22 |
| Breede Valley | 22 | R12.80 | R2.82 |
| Cape Agulhas | 18 | R9.92 | R1.79 |
| Drakenstein | 11 | R7.11 | R0.78 |
| George | 4 | R17.67 | R0.71 |
| Knysna | 43 | R7.84 | R3.37 |
| Langeberg | 14.5 | R3.07 | R0.45 |
| Matzikama | 23.4 | R8.21 | R1.92 |
| Overstand | 26 | R7.00 | R1.82 |
| Saldanha Bay | 3 | R11.59 | R0.35 |
| Stellenbosch | 21 | R20.82 | R4.37 |
| Swartland | 12 | R24.84 | R2.98 |
| Swellendam | 36 | R11.35 | R4.09 |
| Theewaterskloof | 16 | R11.00 | R1.76 |
| Witzenberg | 35 | R17.91 | R6.27 |
| Intervention | First Water | Capacity (MℓD) | Total CAPEX (R million) | Unit CAPEX (R million) | Operating Cost (R/kℓ) |
| Table Mountain Group Aquifer – Steenbras | July 2020 | 25 | 468 | 18.7 | 5.5 |
| Table Mountain Group Aquifer – Nuweberg | July 2023 | 15 | 523 | 34.9 | 5.5 |
| Table Mountain Group Aquifer – Groenlandberg | November 2023 | 12 | 376 | 31.3 | 2.2 |
| Cape Flats Aquifer – Strandfontein | July 2021 | 5 | 378 | 75.6 | 6.5 |
| Cape Flats Aquifer – Hannover Park | May 2022 | 4 | 158 | 39.4 | 8.5 |
| Cape Flats Aquifer – Strandfontein North and East | December 2022 | 15 | 772 | 51.5 | 6.5 |
| Cape Flats Aquifer- Phillippi | December 2024 | 6 | 434 | 72.3 | 8.5 |
| Cape Flats Aquifer – Mitchells Plain | July 2025 | 20 | 673 | 33.7 | 8.5 |
| Atlantis Aquifer Rehabilitation and Expansion | July 2022 | 16 | 314 | 19.6 | 8.5 |
| Berg Voëlvlei River Augmentation Scheme | July 2023 | 40 | 4.62 | ||
| Water Reuse – Faure New Water Scheme | July 2025 | 70 | 1882 | 26.9 | 5.7 |
| Desalination | December 2026 | 50 | 1880 | 33 – 40 | 9.0 |
| Alien Vegetation Clearance | 372 |