
The WMO State of Global Water Resources report is a comprehensive science-based annual assessment of the hydrological cycle and extreme events in 2025 and over the past five years.
- 2025 was one of driest years for river discharge in 35 years
- Past 7 years have seen abnormal river flows
- Water storage on Earth’s land surface has decreased in past 10 years
- Widespread glacier loss across all regions for 4th consecutive year
- Asia and Africa are the regions most affected by water-related disasters
- Water data availability has improved, but gaps remain in hard hit areas.
- 2025 was one of driest years for river discharge globally in 35 years, with below-normal flows over 36% of global basin area. This is based on data from simulations from 13 global hydrological models, driven by observed weather data.
- For the seventh year in a row, the number of river basins with “normal” conditions was in a clear minority: ranging between 34-38%, compared to the average of 46% between 1991-2020, according to the report.
- Terrestrial water storage – the total amount of water stored in groundwater, lakes and rivers, soil moisture, vegetation and ice and snow – has been in decline since mid-2010s.
- 2025 marked the fourth consecutive year with widespread glacier loss across all regions – leading to short term hazards like floods and long-term water insecurity. Between 2023-2025 glaciers lost mass in each reporting year with cumulative global glacier mass loss at 1400 Gigatonnes of water. This is roughly equal to the water required to fill about 560 million Olympic-sized swimming pools, or about one third of annual freshwater withdrawals.
- In each of the past five years, National Meteorological and Hydrological Services around the globe reported record-breaking floods and droughts. Some places have had no recovery time between one event and the next.
Key findings
Climate
2025 was one of the warmest years on record. A weak La Niña emerged towards the end of the year after neutral conditions, and there was a predominantly negative Indian Ocean Dipole, which influenced precipitation.River basins
Across the five reporting years (2021-2025), recurring below-normal river discharge was observed in major parts of the Amazon and La Plata basins, North America, Central and East Africa, Central Asia and the Middle East. Annual river discharge in 2025 was above-normal to much-above-normal across South and South-East Asia and parts of northern South America. In Africa, there were above-normal flows in the Senegal, Niger, Lake Chad, Orange and Limpopo basins, but much-below-normal discharge in the Nile, Congo and Zambezi basins. Below-normal to much-below-normal river discharge affected several major regions, including much of North America, the La Plata and São Francisco basins of South America, Eastern European basins, the Middle East and Central Asia. Reservoir and lake levels followed similar geographical trends as for river basins. African lakes were largely much above normal, with Kariba a notable exception.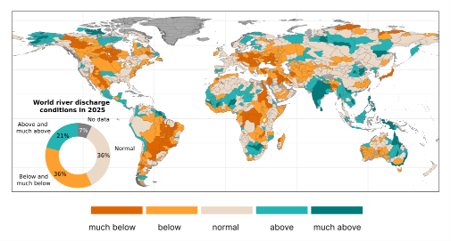
River flows in 2025 compared with the 1991 to 2020 average, from an ensemble of 13 global hydrological models. Source: Simulations of 13 Global Hydrological Modeling Systems. Note: Boundaries indicate river basins outlines only. The boundaries and names shown and the designations used do not imply official endorsement or acceptance by WMO or the United Nations.
Terrestrial water storage
Terrestrial water storage shows a persistent negative trend since 2014-2016 with increasing area under below-normal conditions.
Between 2021-2025 below-normal terrestrial water storage repeatedly affected the south-western United States, Patagonia and the subtropical Andes, the Ganges–Indus headwaters, North Africa, the Middle East, Central Asia and eastern China, while persistent positive anomalies occurred in parts of sub-Saharan Africa, the Sahel and the Tibetan Plateau.
In 2025, it was below-normal in northern and southwestern North America, Patagonia, Eastern Europe, the Middle East, Central Asia, eastern Brazil, northern India, parts of Northern Europe, the Russian Federation, China and Northern Africa. La Plata in South America showed signs of partial recovery from the long-term drought. Much-above-normal storage continued from 2024 into 2025 in Central and Southern Africa.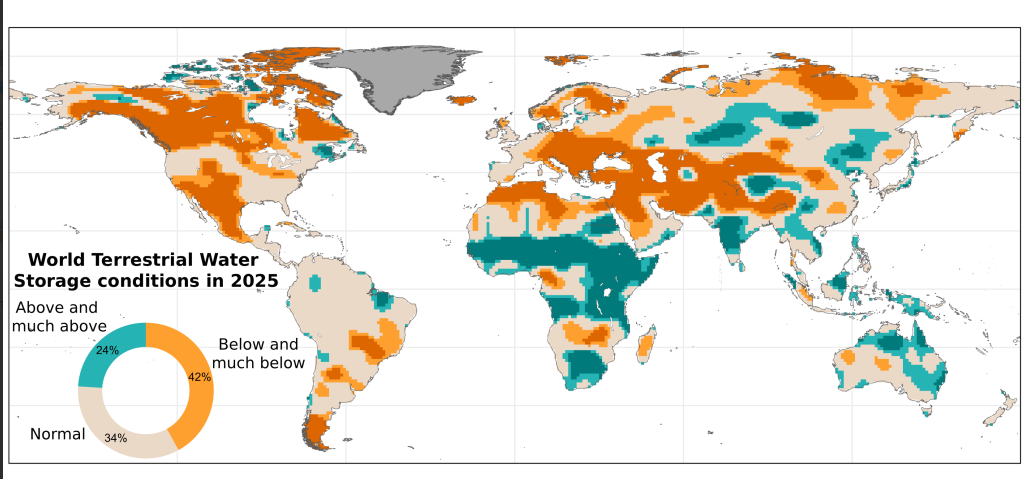
Terrestrial water storage is all the fresh water held on and under land, in groundwater, soil, rivers, reservoirs, snow and ice. This map shows how 2025 compared with the 2002 to 2020 average, measured from space by satellite gravimetry. Note: The boundaries and names shown and the designations used do not imply official endorsement or acceptance by WMO or the United Nations.
Groundwater levels
Persistent groundwater deficits were observed during 2022–2025 in parts of the Americas, Europe, the Middle East, India, southern Africa and Australia. Persistent and widespread below-normal to much-below-normal groundwater levels were observed across Central and Eastern Europe, central United States, parts of Mexico, northern and central Chile, northeastern and central-western Brazil, northern South Africa, northwestern India and parts of southern Australia, pointing to a cumulative depletion with multi-year drying trend. There were above-normal to much-above-normal conditions include parts of France, much of Northern Europe, the southeastern United States, large parts of South Africa, South-East Asia, and eastern Australia.Snow cover and glaciers
Snow conditions were below normal across Europe in 2025, whilst the Russian Federation and North America showed strong regional contrasts. In the hydrological year 2025, glaciers lost 408 (±132) Gigatonnes of mass, equivalent to 1.1 (±0.4) mm of sea-level rise. It marked the fourth consecutive year in which every major glaciated region recorded a net loss. Central Asia, South Asia West, Russian Arctic, Iceland, Western Canada and USA all recorded annual mass balances that ranked among the three most negative years on record for that region. Some regions dominated by smaller glaciers, such as the Caucasus, Western Canada and the USA, and Central Europe may already have reached “peak water conditions,” the threshold where the glacier reaches its maximum runoff due to melting.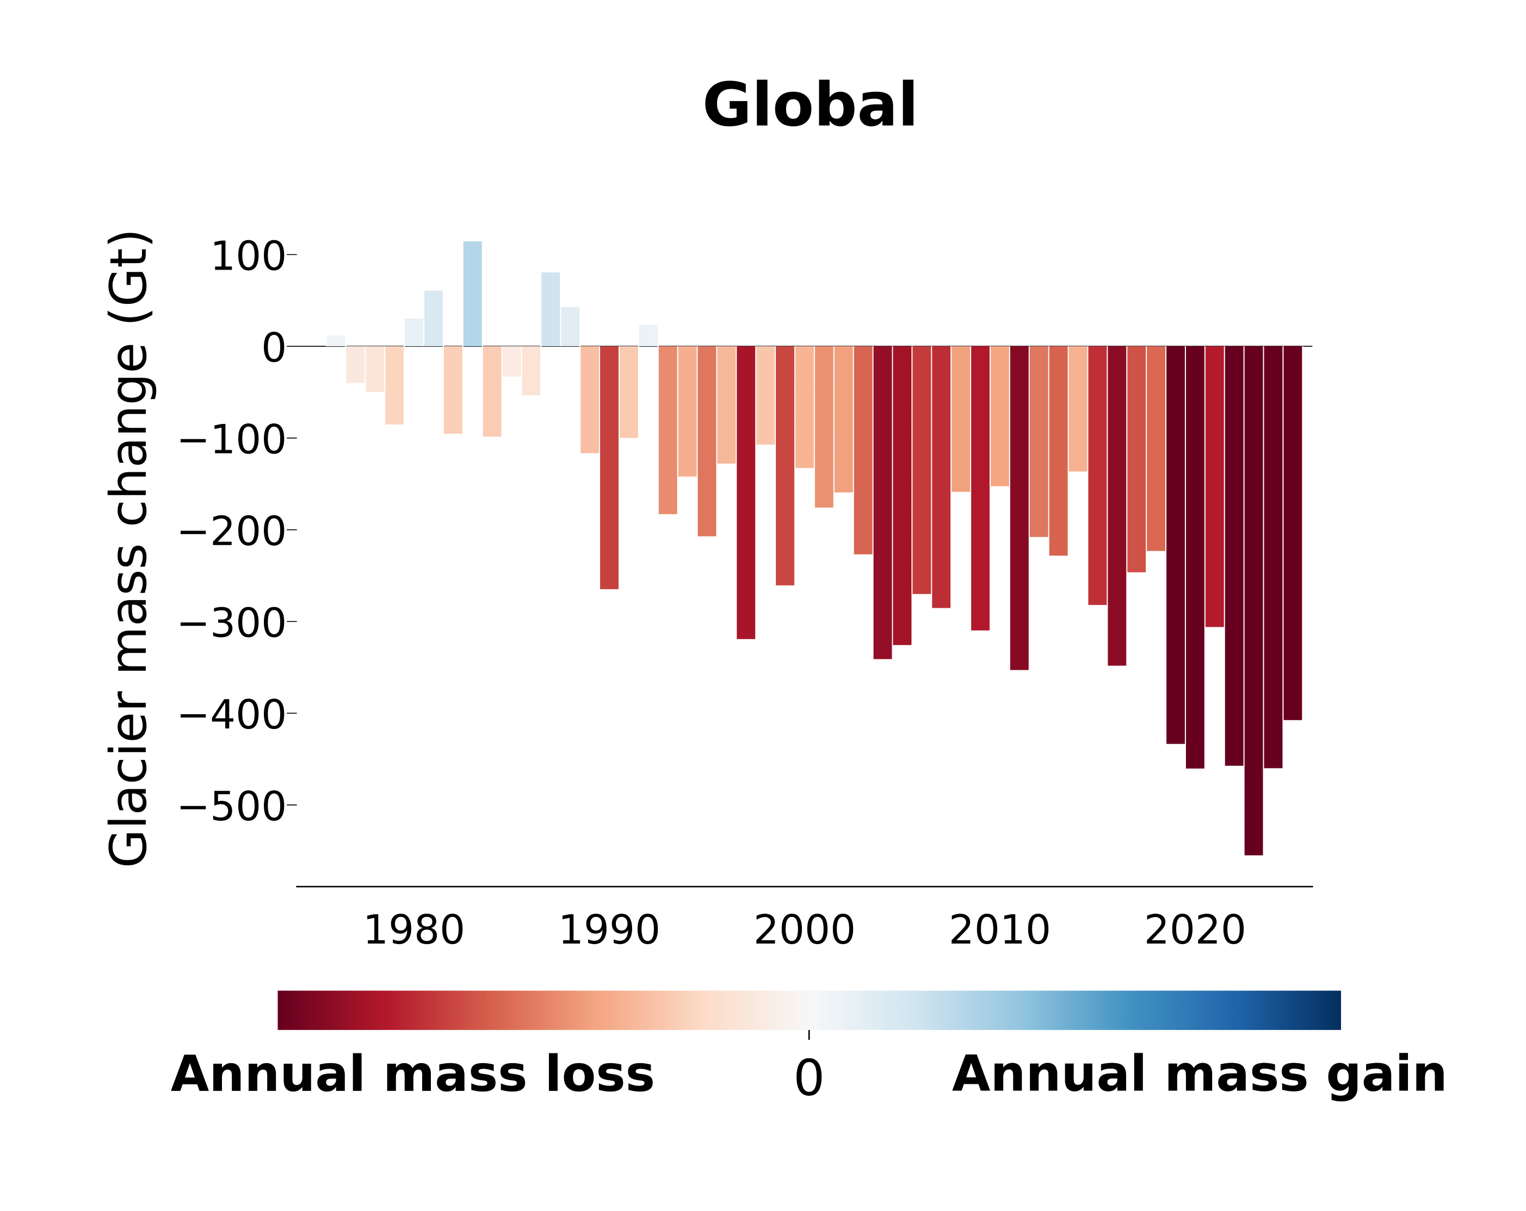
Annual mass change for glacier regions globally. Each bar shows the global glacier mass change in one hydrological year, from 1976 onwards. Blue means glaciers gained ice, red means they lost it. Hydrological years begin at the start of winter and continue through the end of the following summer. Source: World Glacier Monitoring Service