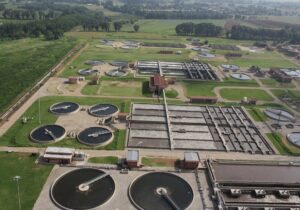
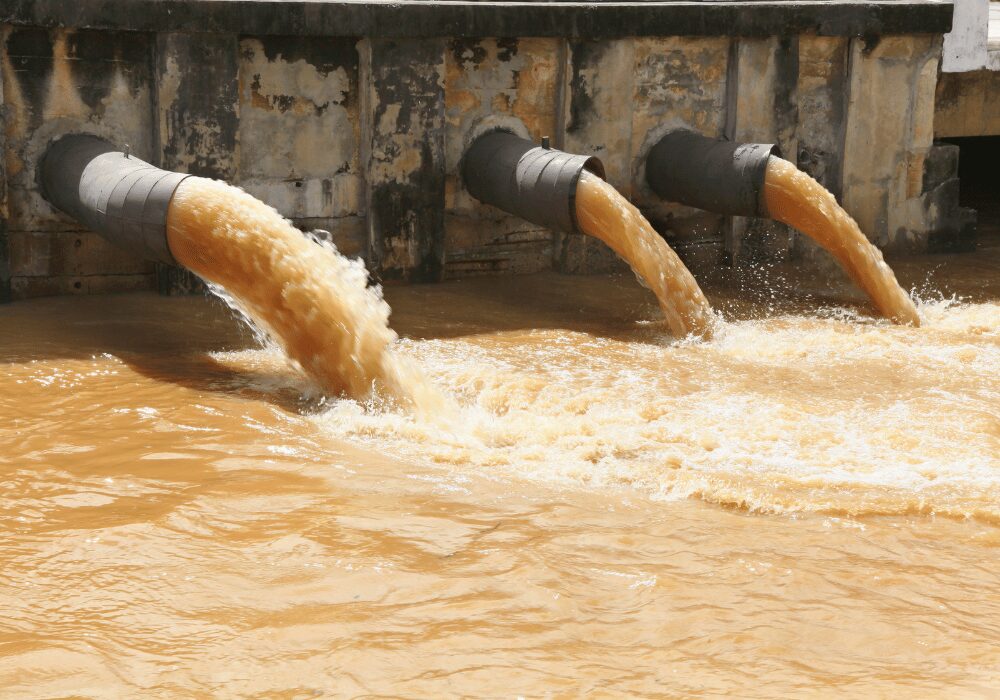
South Africa’s wastewater systems are under growing pressure. The latest Green Drop Report reveals declining performance, rising risk, and mounting infrastructure challenges, with nearly half of treatment works now classified as critical.
What is the Green Drop Certification Programme?
The Green Drop Report is a national regulatory assessment published by the
Department of Water and Sanitation that evaluates the performance, compliance and risk of wastewater management systems across South Africa. It is designed to influence institutional behaviour and drive continuous improvement in the management of wastewater networks and treatment systems.
Scale of the Green Drop Report
- 998 wastewater treatment works (WWTW) audited
- 144 Water Services Authorities (WSAs) assessed across all 9 provinces
- 3 699 pump stations evaluated
- 73 762 km of sewer pipelines assessed
- 174 Technical Site Assessments (TSAs) conducted (physical inspections).
| Province |
Water Service Authorities (WSAs) |
Wastewater treatment works (WWTWs) |
| Eastern Cape |
14 |
125 |
| Free State |
19 |
95 |
| Gauteng |
9 |
61 |
| KwaZulu-Natal |
14 |
148 |
| Limpopo |
10 |
65 |
| Mpumalanga |
17 |
75 |
| Northern Cape |
26 |
75 |
| North West |
10 |
44 |
| Western Cape |
25 |
160 |
| Total |
144 |
848 |
A breakdown of WSAs and WWWs per province
Declining high performance systems
- There has been an increase in the percentage of systems in a critical state of performance, from 39% (334 systems) in the 2022 Green Drop Report to 47% (396 systems) in the 2025 Green Drop Report
- The percentage of systems in excellent or good (above 80%) state of performance declined from 14% (118 systems) in the 2022 Green Drop Report to 8% (66 systems) in the 2025 Green Drop Report
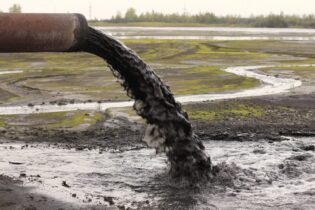
This means that nearly half of WWTWs in South Africa are non-compliant and not performing well. Systems that were performing poorly have dropped to critical, and if the scope includes poorly performing as well as critical, then 61% of all WWTWs in South Africa are performing below the minimum required level.
Drop in Green Drop Certifications
A wastewater system qualifies for Green Drop Certification when it achieves an overall Green Drop score of 90% or higher, reflecting strong performance across key areas such as treatment efficiency, risk management, technical capacity, and regulatory compliance.
14 Systems achieved Green Drop certification (≥90%)
This is down from:
- 22 (2021)
- 60 (2013)
- 40 (2011).
| |
Province |
Municipality |
Treatment Plant |
| 1 |
Gauteng |
City of Ekurhuleni |
Benoni |
| 2 |
Carl Grundlingh |
| 3 |
Daveyton |
| 4 |
Herbert Bickley |
| 5 |
JP Marais |
| 6 |
Welgedacht |
| 7 |
Midvaal Local Municipality |
Bantu Bonke |
| 8 |
Ohenimuri |
| 9 |
Mpumalanga |
Steve Tshwete Local Municipality |
Blinkpan |
| 10 |
Western Cape |
Saldanha Bay Local Municipality |
Hopefield |
| 11 |
Paternoster |
| 12 |
Shelly Point |
| 13 |
City of Cape Town |
Wesfleur Domestic |
| 14 |
Witzenberg Local Municipality |
Op-die-berg |
2024 Green Drop Certified Systems
What’s new in the Green Drop Report?
For the first time, Non-sewered Sanitation (NSS) and Water Efficient Sanitation Solutions (WESS) concepts were incorporated into the audit. This inclusion expands the scope of the assessment beyond conventional, centralised wastewater treatment systems to recognise alternative sanitation technologies, particularly in areas where traditional sewer infrastructure is not feasible.
| |
Non-Sewered Sanitation and Water Efficient Sanitation |
| Province |
Households using dry sanitation |
Volumes emptied (m³/month) |
Records of trucks collecting and emptying |
Method of disposal / treatment |
| Not applicable |
Yes |
No / No proof |
| Eastern Cape |
68 316 |
5 886 |
18 |
8 |
99 |
Tankers to WWTWs; sewer network collection |
| Free State |
131 036 |
NI |
24 |
NI |
71 |
Tankers to WWTWs |
| Gauteng |
644 571 |
73 417 |
27 |
20 |
14 |
Tankers to WWTWs; discharge at manhole |
| KwaZulu-Natal |
17 679 |
228 |
68 |
33 |
47 |
Tankers to WWTWs |
| Limpopo |
167 |
NI |
20 |
2 |
43 |
Tankers to WWTWs |
| Mpumalanga |
60 817 |
8 356 |
20 |
15 |
40 |
Tankers to WWTWs |
| Northern Cape |
15 510 |
2 876 |
23 |
2 |
50 |
Tankers to WWTWs; urine diversion system (one system) |
| North West |
53,528 |
NI |
9 |
NI |
35 |
NI / N/A |
| Western Cape |
95 000 |
555 |
97 |
10 |
53 |
Tankers to WWTWs; Borchard’s Quarry FSM facility (CoCT) |
| Total |
1 086 624 |
91 318 |
306 |
90 |
452 |
— |
National Summary of the Non-Sewered Sanitation/ Water Efficient Sanitation Solutions
Skills
58% of wastewater treatment works have sent staff for training in the past two years, up from 38% in 2021.
The worst-performing municipalities have the lowest training participation, reinforcing a cycle of underperformance
R13.34 billion identified by Very Rough Order of Measurement (VROOM) analysis that is to restore wastewater infrastructure nationally to functional condition. VROOM is a national estimate of rehabilitation cost, not a detailed budget. It is used to prioritise capital investment intervention.
While pockets of excellence remain, the overall trajectory highlights an urgent need for coordinated investment, stronger governance and sustained technical support to stabilise and rebuild South Africa’s wastewater sector.